
For more than three decades, American families have watched college prices climb
faster than their paychecks. But the story isn't a straight line of decline—there were
years families lost significant ground, and a recent stretch where income finally began to close the gap. Using College Board tuition data (Table CP-2) and U.S. median household income, the three charts below trace how income growth, college costs, and inflation have moved against each other from 1990 to 2024.
Chart 1 — Purchasing Power vs. College Costs (with CPI)
Annual income growth minus college cost growth, by sector, with CPI overlay
(1990–2024)
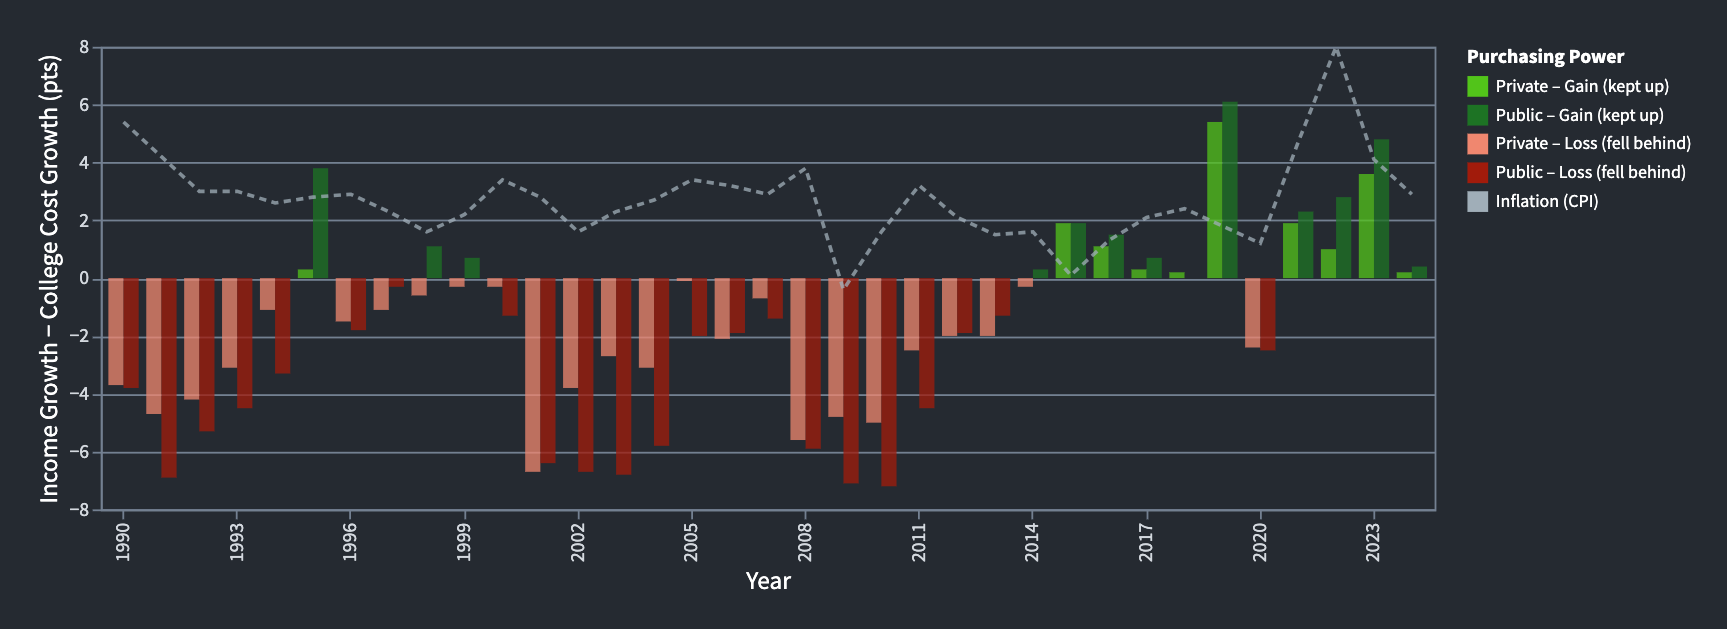
This chart shows the yearly gap between household income growth and college cost growth. Red bars mark losing years (income fell behind college costs); green bars mark winning years (income kept pace or pulled ahead). The pattern is stark: the 1990s and 2000s were dominated by red—families lost ground almost every year, with the worst gaps in 2001–2003 and 2008–2010, when income stalled during recessions while tuition kept climbing 6–9% annually. The tide turned around 2014–2015, and green bars now dominate, driven by strong nominal wage gains in 2019 and 2022–2023.
Chart 2 — Cumulative Divergence Index (1990 = 100)
Cumulative growth of income vs. private and public college costs, indexed to 1990 = 100
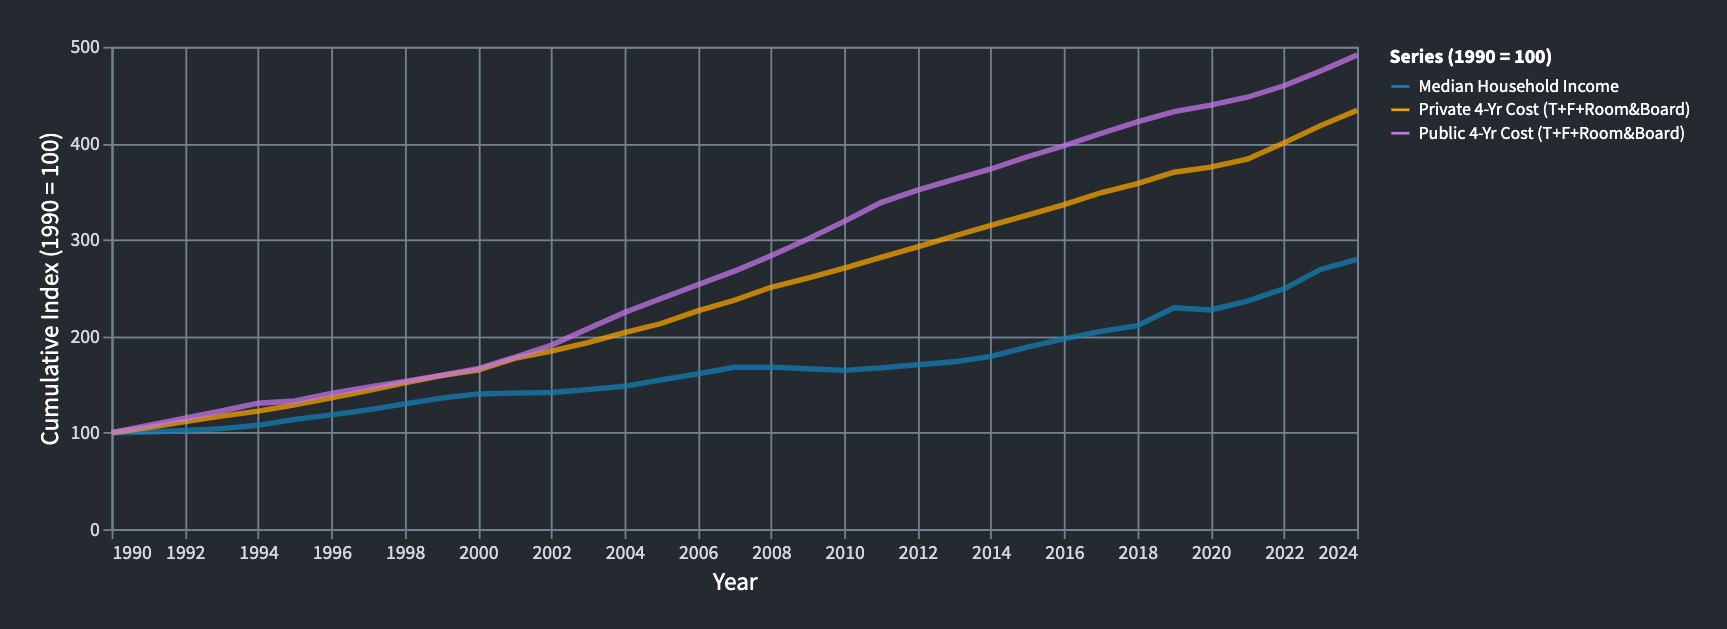
This index reveals the accumulated damage. By 2024, public four-year all-in costs had grown to roughly 492 and private costs to 434, while median household income reached only about 280 (1990 = 100). The gap widened relentlessly through the 2000s—public college costs nearly tripled while income barely doubled—before the lines began running roughly parallel in the mid-2010s. The divergence has stopped growing, but the cumulative gap built up over 25 years has not closed.
Chart 3 — Nominal Dollar Levels
Median household income vs. private and public four-year total cost in nominal dollars (1990–2024)
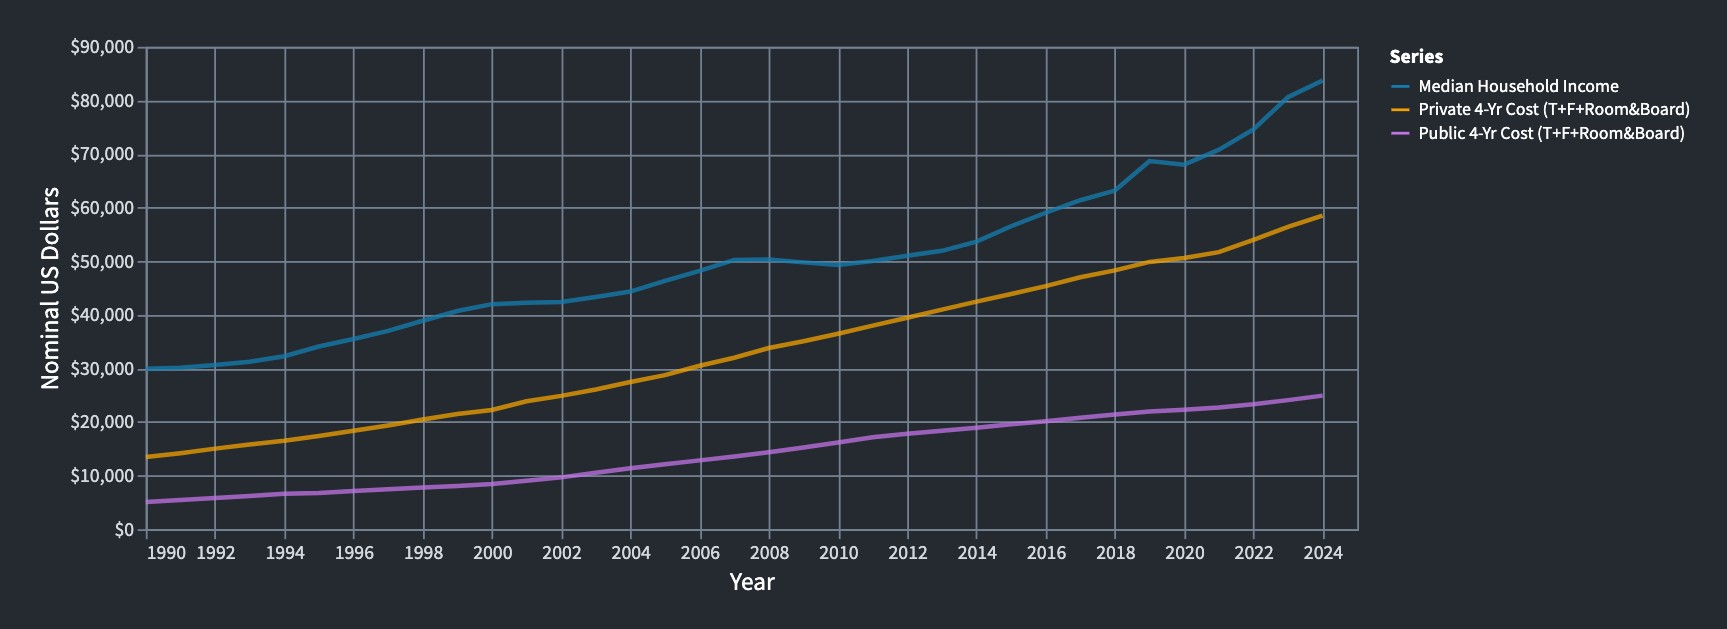
In raw dollars, median household income rose from about $29,940 to $83,730, while private four-year total cost (tuition, fees, room and board) climbed from $13,480 to $58,500 and public cost from $5,070 to $24,920. Public college remains the most affordable relative to income, but private college costs now consume roughly 70% of a median household’s annual income—up from about 45% in 1990.
Key Takeaways
The answer to our opening question is: not for most of the last 35 years, but recently, yes. Families steadily lost purchasing power against higher education from 1990 through roughly 2013, with the sharpest erosion during recession years when incomes stalled but tuition kept rising. Since 2014, income growth has finally begun outpacing tuition increases—college price growth has cooled to 2–4% annually while wages accelerated—allowing families to slowly regain ground. However, the cumulative gap built up over two decades means college remains far less affordable in absolute terms than it was in 1990. The recent trend is encouraging, but it would take many more years of income outpacing costs to fully reverse the divergence.